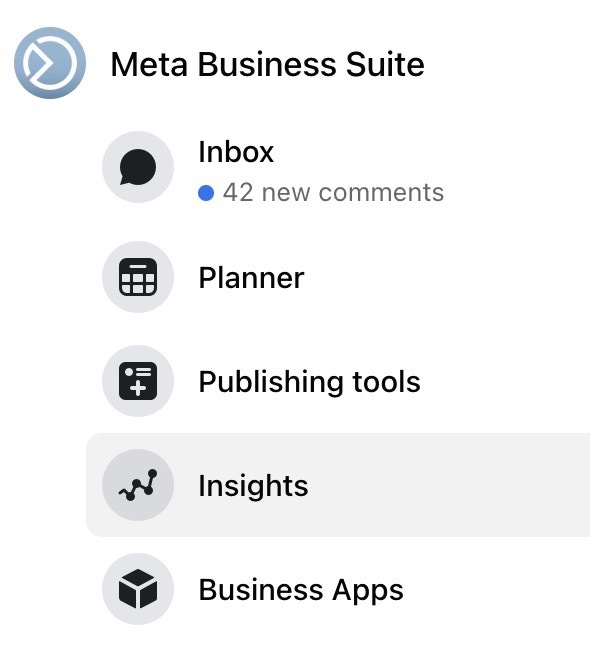
You always see insight buttons on the front pages of your business’s social media platforms. These social networks may include Facebook, Instagram, X (formally known as Twitter), LinkedIn, and YouTube. For this blog, we will focus on the ever-popular Facebook as an example.
What will clicking these insight buttons reveal about your business? Insights will take you on a journey to understand what works and doesn’t work with your social media business strategy. Insights will present your data in various forms, including activity, goals, and results.
- Activity
Activity insights show how many pieces of content you have posted for the week. These could be posts, stories, or paid ads. Consistency is key here. It’s essential to have a dynamic social media platform and to post often—but not too often.
It also illuminates which social media platform is best for your business. Activity insights will show you where the holes are and help you determine where you should add more content to reach more followers.
- Goals
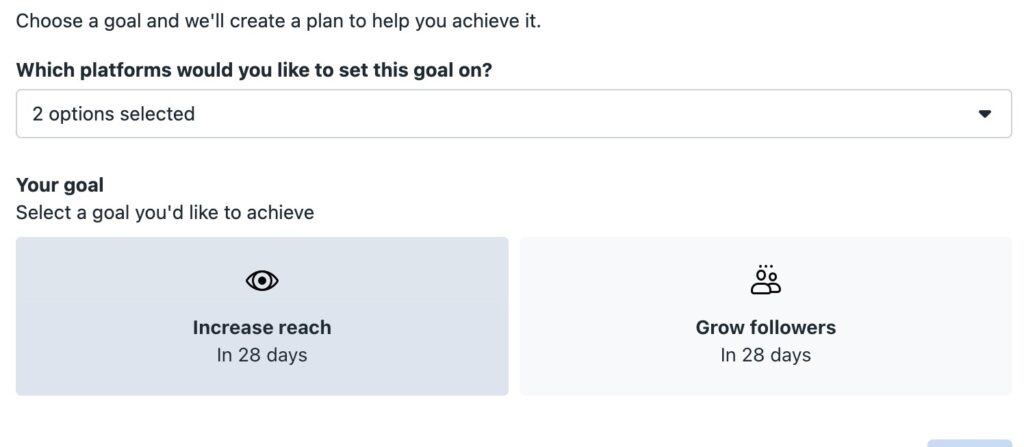
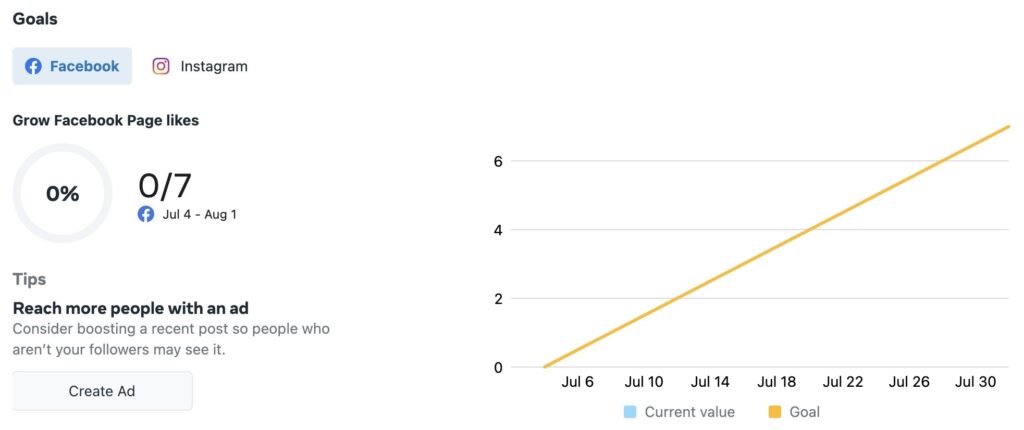
Having a business plan is vital for growth. Platforms like Facebook have monitoring options to help you set goals and track followers to your page and likes to your posts. As Facebook and Instagram are often connected, breaking your goals down even further by either platform is possible.

Once you set your goal, you can monitor the progress of your audience’s growth. By having a weekly visual display of your progress, you may decide that you need to incorporate paid ads to satisfy your objectives.

- Results
On Insights, you can view your platform’s organic and paid reach. Organic reach is the social media traffic you bring in from people liking and sharing content posted on your social media platforms. It’s important to encourage your customers and followers to like and share your posts to increase your organic reach.
You can also determine which days of the week your posts are getting more likes and which times of the day your followers are most active on the platform.
Businesses that do not keep an eye on their insights cannot determine the holes in their social media plan. Shoot-from-the-hip social media postings and inconsistency will not build up the following you need to help understand your target audience.

Now that you have gathered your insight data, it’s time to make the best use of it by creating a social media report. Reports are a great way to document your performance data.
They also help business owners communicate necessities with their teams. These may include details like adjustments to social media graphics, for example, or which products or services are getting the most attention.
What Is a Social Media Report?
A social media report is a document used by an organization to track and analyze insight data. A report doesn’t have to be fancy; it can be a simple Excel sheet. There can also be multiple reports used within your organization, depending on what perspective needs analysis (i.e., demographics, post engagement, or cities where followers reside).
Social media reports will bring awareness and give perspectives you may not have ever considered, such as gender and income demographics. This information is important to share at team meetings and with investors when developing products and services.
Social media reporting can help you develop campaigns. You can use these reports to compare effective strategies from one year to the next, especially with seasonal data such as clothing. You can also discover industry trends. You’ll create smarter posts when you know what people are looking for and maximize the exposure of your efforts.
Social media reports should be clean and easy to follow.
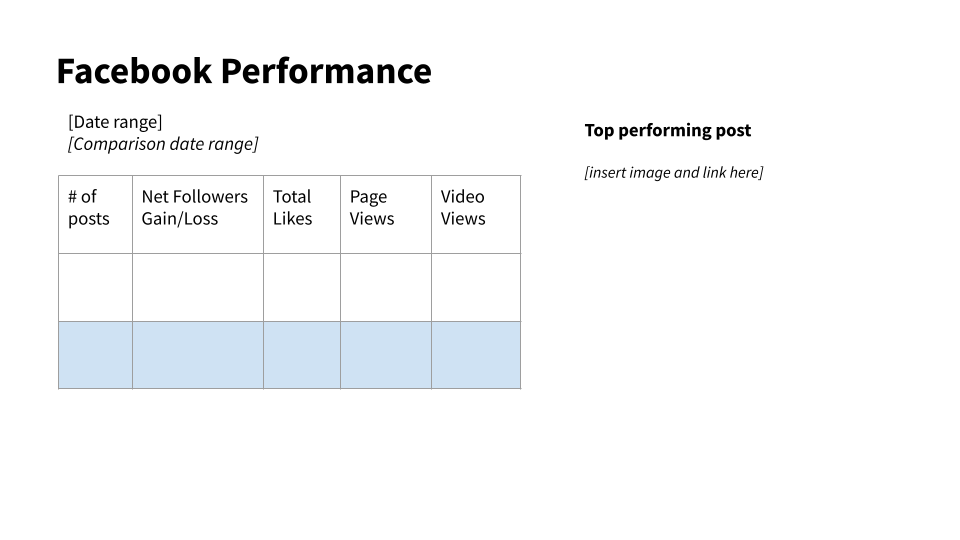
Some third-party companies such as HootSuite, Cyfe, and Google Analytics provide performance and engagement data, offering an array of pie graphs and detailed insights. Some of these parties offer free templates for social media reports, such as the performance report example from HootSuite below, showing a simplified example of what a report could look like:

Get familiar with your insight data. Check out the overviews, toggle different data months, get to know your audience, and don’t forget to look at feedback from customers and followers.

The more you deep-dive into what social media can tell you, the more you can develop campaigns that benefit your business. Ultimately, this dedication will turn you into an experienced social media strategist!
Now it’s time to create your report.
Here are 5 steps to creating a social media report.
Step 1: Choose the right social media reporting tool
As we mentioned above, there are a lot of social media reporting tools on the market these days. So how do you choose the right one for your business? Here are a few tips to help you make the right decision.
- Look for a tool that is easy to use. The last thing you want is a reporting tool that is difficult and takes up too much of your time.
- Make sure the tool provides you with all the information you need. It should include data on followers, engagement, reach, and more.
- Choose a tool that is affordable. You don’t want to break the bank when it comes to purchasing a social media reporting tool.
- Make sure the tool is compatible with the social networks you use most often.
- Finally, be sure to test out several different tools before making a decision.
Step 2: Gather data from social media accounts
In order to gather the data for your social media analytic report, you will need to access your company’s social media accounts. This may include Facebook, X (formally known as Twitter), LinkedIn, and others. If you do not have access to these accounts, you will need to ask someone who does have access to help you gather the data.
The first step is to determine which social media platforms your company is using. Once you have this information, you can begin gathering data from each platform. This includes the number of followers or fans, engagement (likes, comments, shares), and reach (the number of people who saw your post) as discussed in the first part of this blog.
You will also want to look at any trends that may be occurring on the social media platforms. For example, if you notice that engagement is decreasing on X (Twitter), you may want to focus more of your efforts on Facebook.
Step 3: Analyze data to find trends
After collecting social media data, the next step is to analyze it to find any trends. This involves taking a close look at the numbers to see if there are any patterns emerging. For example, if you notice that your Facebook page Insights show that more people are engaging with your content on Thursdays than on any other day of the week, you might want to consider posting more content on Thursdays. Or, if you see that fewer people are clicking through to your website from X (Twitter) than from other social media platforms, you might need to adjust your X (Twitter) strategy. By analyzing your data, you can make informed decisions about what content to create and where to focus your efforts.
Step 4: Create graphs and tables to illustrate findings
In this step, you will create graphs and tables to illustrate your findings from your social media report. It is important to choose the right types of graphs and tables that will effectively communicate your findings. You should also be sure to title your graphs and tables accurately so that your readers can understand their purpose.
Step 5: Present findings in a clear and concise manner
Now that you have gathered your data and conducted your analysis, it is time to write up your social media report. The goal of your report is to provide a clear and concise summary of your findings that can be easily understood by your audience.
Creating and utilizing a social media report can help businesses improve their online presence, boost customer engagement, and better understand their target audience. By tracking key metrics and trends, businesses can adjust their social media strategy to produce better results.
Now that you have learned the ins and outs of a social media report, it is time to write up your own! The goal of your report is to provide a clear and concise summary of your findings that can be easily understood by your audience. Want to discuss your results? Join us at our next Networking Business Meeting and connect with other businesses to develop growth for you and your organization.
